

PM Images
Master Limited Partnerships (MLPs) have been favorites among the income investor community as they often distribute large amounts of their income to unitholders. Energy Transfer (NYSE:ET) has been one of my favorite companies through thick and thin, as this will be the 31st article I have written about them. I was still bullish on ET when they reduced the distribution, and my conviction has never wavered. While I am invested in many different companies, I have a sweet spot for investing in companies with physical assets critical to society. The energy infrastructure industry may not be exciting enough to grab headlines, but without energy infrastructure, society as we know it wouldn’t function. Going into earnings season, I still feel units of ET are undervalued, and they are the best value from the largest pipeline MLPs. Ultimately, I feel that units are headed higher.
Seeking Alpha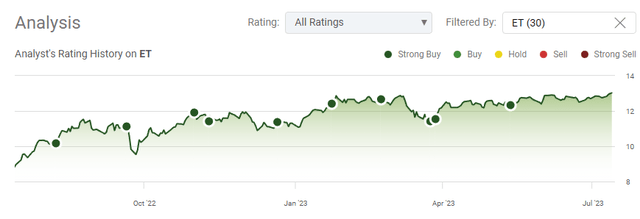
Investors should take a closer look at what Energy Transfer has accomplished since the distribution reduction
In the fall of 2020, ET slashed its distribution in half to focus on the balance sheet. The quarterly distribution went from $0.305 to $0.1525 as management took a page out of Kinder Morgan’s (KMI) book. ET finished 2020 with the highest level of debt it amassed in the past decade, with $52.33 billion of total debt on the balance sheet. When I look at what ET has accomplished, I feel that they have accomplished their goals and provided value for their investors. ET has acquired three companies, increased its cash flow, reduced its debt, and restored the distribution. It’s hard to argue that ET isn’t a stronger company today than it was even pre-pandemic in 2019.
Energy Transfer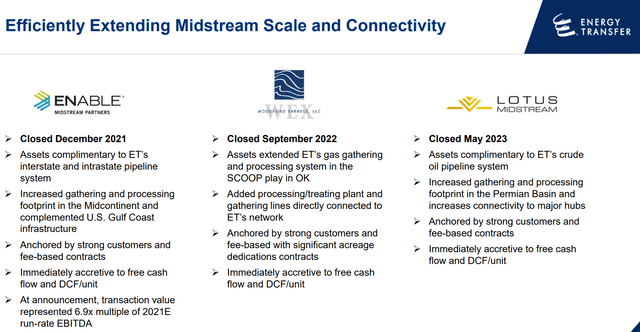
In less than two years, ET has acquired Enable Midstream, Woodford Express, and Lotus Midstream. Prior to these acquisitions, ET had acquired SemGroup in 2019 and has continuously grown its operations into the largest midstream operator by pipeline miles, revenue, EBITDA, and distributable Cash Flow (DCF). Today, ET has nearly 125,000 miles of pipeline moving fossil fuels across the U.S. ET has created a nearly impenetrable moat. One of the main reasons I love investing in physical assets that are critical to society is that they are dependent upon no matter what the narrative is. MLPs are continuously adding new takeaway capacity to their systems to meet future demand, and new companies are unlikely to become extrarenal threats. Due to capital intensity, permitting, environment studies, land requirements, engineering regulations, red tape, and operational knowledge, new companies aren’t knocking down the door to build pipelines. Between this and the need for existing MLPs to add takeaway capacity, ET is operating in a sector that is next to impossible to penetrate.
By adding Enable, WEX, and Lotus Midstream, ET has grown into the largest midstream operator in the U.S., generating incremental revenue throughout the value chain from start to finish in crude oil, natural gas, and natural gas liquids (NGLs). ET operates 14,300 miles of crude oil trunk and gathers lines in its crude segment. In the NGL and refined products business, ET has 3,700 miles of refined products pipelines and 5,650 miles of NGL pipelines. ET is operating 53,500 miles of gathering pipelines in its midstream segment, while its interstate natural gas pipeline segment has grown to 27,000 miles. ET also operates 11,385 miles of intrastate natural gas pipeline. ET’s natural gas business can gather 19.8 million MMbtu/d of gas and produce 811,000 Bbls/d of NGLs. It also has the capacity to transport 31.5 million MMbtu/d of natural gas through its interstate and intrastate pipelines. ET can fractionate 949 thousand Bbls/d of NGLs. On the crude segment, ET has the capacity to transport 4.2 million Bbls/d of crude. ET is also an exporting powerhouse that can export 1.1 million Bbls/d of crude and 1.1 million Bbls/d of NGLs.
Energy Transfer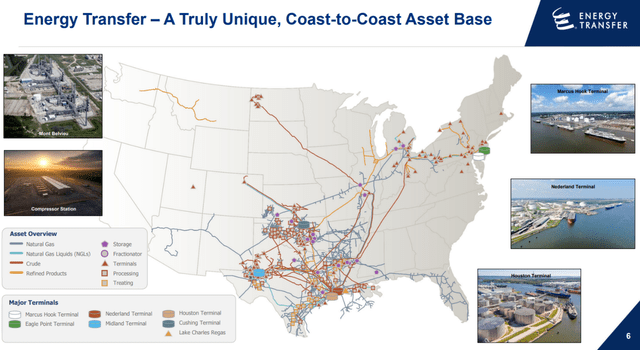
ET has grown into this powerhouse while improving its metrics up and down the line. In 2019, ET generated $54.21 billion in revenue, $10.42 billion in EBITDA, and delivered $2.1 billion in free cash flow (FCF). ET finished 2020 with $52.33 billion in total debt. As the baseline, I am using 2019’s income metrics due to the lockdowns during 2020 because the lowered income numbers look like a one-time occurrence.
So what has happened since the close of 2020, and substituting 2020’s income for 2019’s so the numbers don’t look inflated? Since ET has only reported its 1st quarter of 2023, I will use 2022’s income statement. From the close of 2019 to 2022, ET has grown its revenue by 65.78%, going from $54.12 billion to $89.88 billion. ET’s EBITDA increased by 17.88%, growing from $10.42 billion to $12.29 billion, and ET’s FCF grew 212.45% to $6.55 billion as its cash from operations increased and capex decreased. On the debt side, as of the latest report, ET had $48.07 billion in total debt, a decrease of -8.15% from the $52.33 billion of total debt on the balance sheet at the end of 2020. The impacts from acquiring Lotus Midstream haven’t even been felt yet, as the deal closed in May of 2023, and ET is projecting it will add FCF and DCF per unit.
I remember that in a previous article, one of the readers mentioned they would like to see the numbers on a per-unit basis, and I am happy to add this here. At the end of 2019, ET had 2.69 billion units; at the end of 2022, it had 3.09 billion units. I am rounding off, but I will use the exact units from Seeking Alpha in the calculation. In 2019, ET produced $20.15 per unit in revenue compared to $29.04 in 2022. On a per-unit basis, the revenue grew 44.10%. ET’s EBITDA grew by $0.10 or 2.47% per unit to $3.97. ET’s FCF increased by $1.34 or 171.59% per unit to $2.12.
Since the distribution reduction, ET has grown the company, reduced the debt load, and increased revenue and profitability. In addition, ET has also not just restored its distribution to its former level, but recently provided unitholders with an increase that surpassed the 2020 distribution. For as much doom and gloom that gets associated with ET, the numbers don’t lie, and ET is firing on all cylinders.
ET still looks like the most undervalued MLP going into earnings season
I am forming ET’s peer group from the Alerian MLP ETF (AMLP). The largest holdings in AMLP are:
- Plains All American Pipeline (PAA)
- Magellan Midstream Partners (MMP)
- MPLX LP (MPLX)
- Enterprise Products Partners (EPD)
- Energy Transfer (ET)
From the peer group, I am comparing these MLPS on the following metrics:
- Market Cap to DCF ratio
- Market Cap to Adjusted EBITDA ratio
- Enterprise Value to Adjusted EBITDA
- Debt to Adjusted EBITDA
- Distribution Yield
Seeking Alpha, Steven Fiorillo
I want to pay the best multiple for an MLPs DCF. ET trades at 4.57x its DCF as it has produced $8.75 billion in DCF over the TTM. ET is trading at a significantly lower multiple than the peer group average of 7.04x, and trades at the lowest valuation in the peer group.
Steven Fiorillo, Seeking Alpha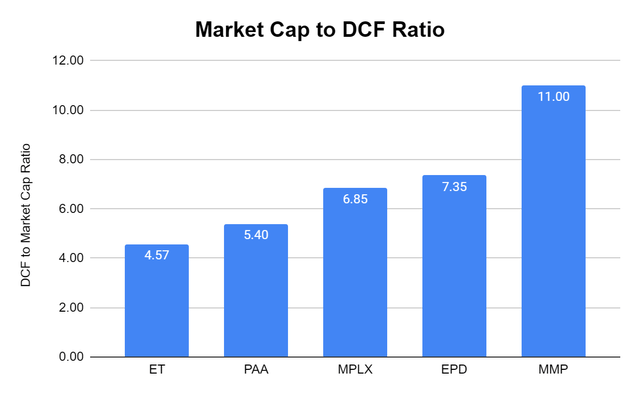
Looking at the Adjusted EBITDA, ET is also trading at the lowest multiple in this metric as well. ET trades at 3.03x its Adjusted EBITDA while the peer group average is 5.43x.
Steven Fiorillo, Seeking Alpha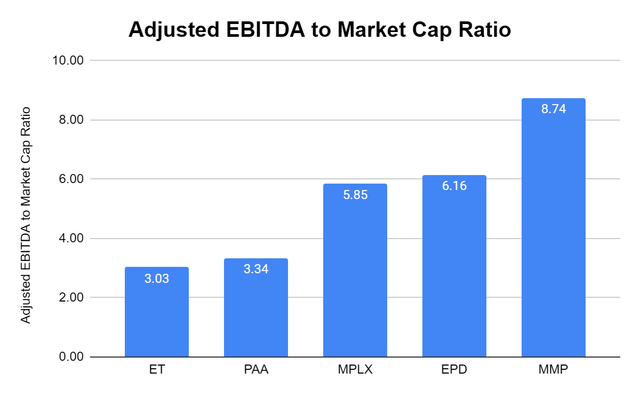
In addition to market cap, I am also looking at the enterprise value to Adjusted EBITDA, and ET trades at 7.69x, compared to the peer group average of 8.76x.
Steven Fiorillo, Seeking Alpha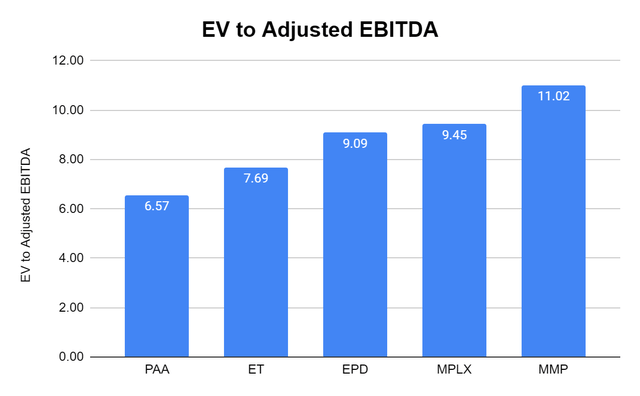
ET has also been criticized for its debt load. I don’t have a problem with tapping the debt market if the company is able to service the debt and if it’s not leaps and bounds higher than their respective peers. The peer group has a total debt to Adjusted EBITDA multiple range of 2.53x to 3.65x. ET comes in on the high side at 3.65x, and the peer group trades at a 3.25x multiple. This is a pretty tight range, and since ET generates the largest amount of DCF and Adjusted EBITDA, I am not bothered by it coming in at the top of a tight range.
Steven Fiorillo, Seeking Alpha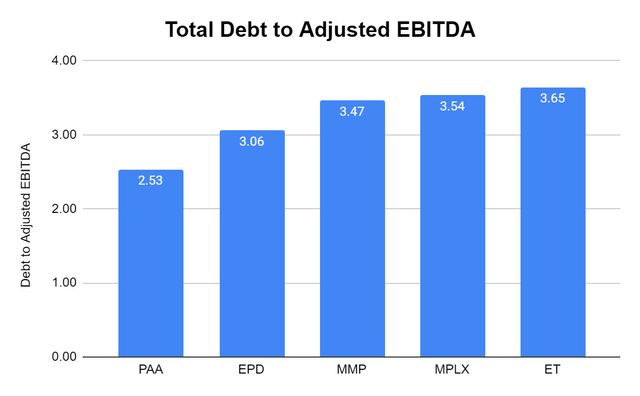
The last aspect is the distribution yield. The peer group has a range of producing a distribution yield of 6.55% to 9.53%. The peer group average is 7.98% and ET is generating a 9.53% yield.
Steven Fiorillo, Seeking Alpha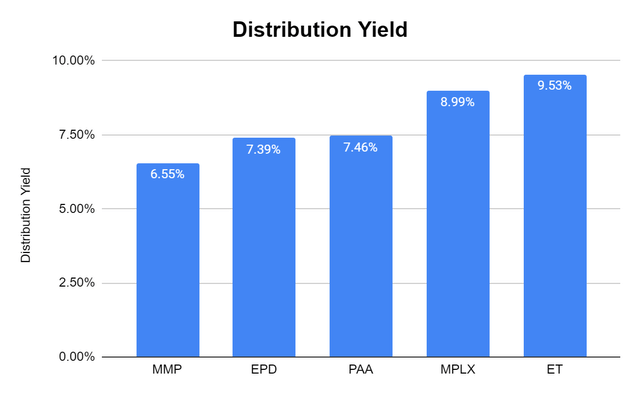
Currently, ET generates the largest amount of revenue, Adjusted EBITDA, and DCF in the peer group. ET has the largest distribution yield and trades at the lowest market cap to Adjusted EBITDA and Market cap to DCF multiple in the group. Its total debt and EV to Adjusted EBITDA is well within a respectable range of its peers. The numbers make ET look very undervalued. ET currently has a market cap of $39.95 billion. If ET had a market cap of $61 billion, it would trade at 4.63x its Adjusted EBITDA, which would still be under the 5.43x peer group average, and its market cap to DCF would be 6.98x which would be under the 7.04x peer group average. To get close to but still under these peer group averages, units would have to increase by 52.70%.
Conclusion
Going into earnings season, ET looks like a steal. This is a company that has transformed its business through financial discipline. The company is larger, generating more profits, and has less debt than in 2019 and 2020. The distribution is restored, and management has indicated that they will reward unitholders with future distribution increases. ET is trading at a steep discount to its peers without a good reason. This isn’t the ET of 2019, and today’s ET is the largest energy infrastructure company in the U.S., and the impacts from the acquisition of Lotus Midstream haven’t been recognized yet. I think there is a real opportunity here, and investors are getting paid 9.53% for what I consider an undervalued company. Based on the numbers, I believe ET is undervalued by at least 50%, and if my numbers are accurate, it would put units at $19.70. I will continue to be extremely bullish on ET until there is a real reason not to be.
Credit: Source link